Local data reveals where Arizona’s housing boom has settled, where momentum remains, and why year-over-year rankings only tell part of the story.
On a quiet street in Sedona, a home sits just shy of one hundred days on the market.
A year ago, it wouldn’t have lasted a week.
The price is still high higher than it was two years ago, but the urgency is gone. Showings come more slowly now. Conversations feel different. The question is no longer how high can it go, but what does fair look like now? That shift is happening across Arizona.
Recently, Zillow and Redfin published rankings naming the Top 10 Arizona cities by year-over-year home price growth led by Sedona, followed by a mix of metro, lifestyle, affordability, and retirement-driven markets.On paper, the list suggests broad, continued acceleration.
But when you look past the rankings past where prices were last year a more revealing story emerges.
Arizona home prices aren’t surging anymore. They’re sorting.
Growth Happened. What Comes Next Is Different.
The Zillow and Redfin numbers reflect something real. Arizona experienced one of the most aggressive appreciation cycles in the country, and those gains did not disappear in 2025. They settled.
Arizona Ascent’s local market data is drawn from real-time listing behavior, inventory movement, price-per-square-foot trends, and days on market.
Our data shows prices across much of the state stabilizing at elevated levels, while buyer behavior becomes more deliberate and sellers recalibrate expectations.
Homes are spending more time on the market.
Price reductions are more common. Inventory is no longer evaporating overnight. This isn’t a downturn. It’s a transition.
What makes this moment different isn’t the data it’s the feeling. A year ago, buyers felt rushed and sellers felt untouchable. Today, conversations are slower. Decisions are more considered. Expectations on both sides have shifted. January 2026 marks the first full cycle where Arizona homeowners are no longer reacting to a boom, but learning how to live inside what came after it.
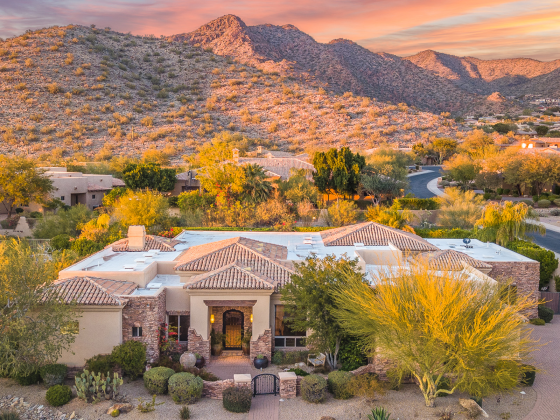
Sedona: When the Run Is Over
(Top 10 YoY growth leader: 26.0%)

Sedona sits at the top of every growth list, and it earned that position. Limited housing stock, second-home demand, and lifestyle migration drove prices sharply higher.
Today, the median list price is about $1.32 million, with homes averaging $519 per square foot. Inventory has climbed to roughly 140 active listings, and homes now spend close to 100 days on the market. Nearly four in ten listings have reduced their price. Sedona didn’t lose its appeal. It absorbed it.
Catalina Foothills: One Name, Many Markets
(Top 10 YoY growth: 12.4%)
Catalina Foothills appears as a single market in rankings, but on the ground it behaves like several. Luxury enclaves such as 85718 continue to command prices near $1.2 million, while areas like 85750, 85715, and 85712 show more variation and higher rates of price reductions. Across the Foothills, prices are holding not climbing and momentum differs sharply by ZIP code.
Chandler: Where the Market Grew Up
(Top 10 YoY growth: 5.0%)
Chandler remains one of Arizona’s most liquid housing markets. Median list prices hover around $564,000, supported by employment density and population growth. But the pace has changed. More than half of active listings have reduced prices, and homes are taking longer to sell. Stability has replaced urgency.
Florence: Affordable, Not Accelerating

(Top 10 YoY growth: 5.0%)
Florence’s appeal lies in accessibility. With median prices near $365,000, it continues to draw buyers priced out of the metro core. Inventory has increased, but demand remains steady enough to hold values, not push them higher.
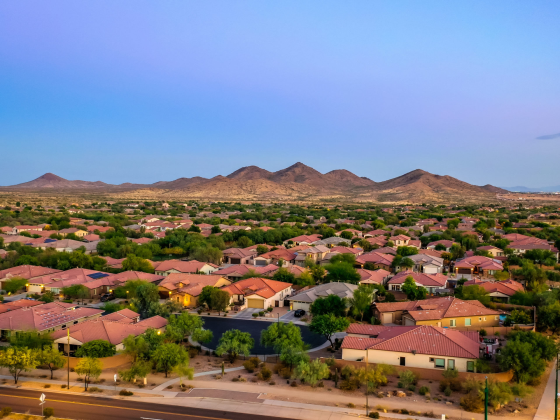
Anthem: Supply-Constrained Stability
(Top 10 YoY growth: 4.8%)
Anthem’s tightly managed housing stock continues to support pricing. Inventory remains relatively low, and values are holding. Still, growth has flattened. Sellers retain leverage, but buyers are no longer rushing. The market feels balanced by design.
Fort Mohave: Where Momentum Still Exists
(Top 10 YoY growth: 4.5%)
Among the Top 10, Fort Mohave stands apart. With a median list price around $399,000, fewer price reductions, and demand continuing to outpace supply, it remains one of the few Arizona markets still showing forward pressure.
Yuma: Stability Through Absorption
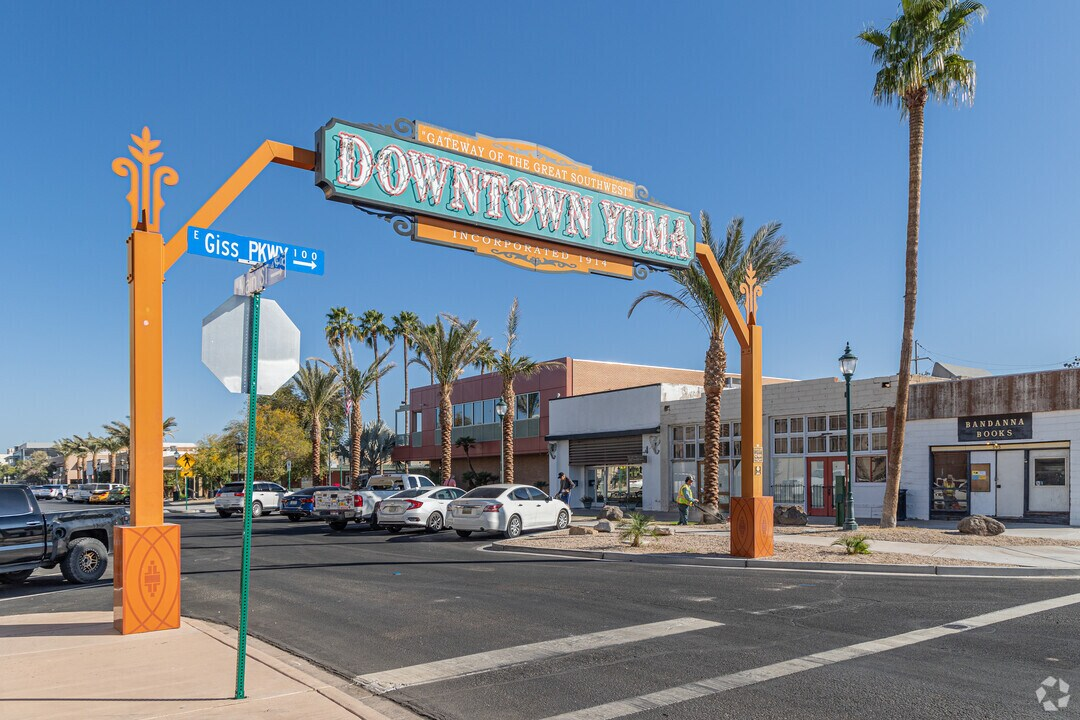
(Top 10 YoY growth: 4.2%)
Yuma’s median prices sit near $380,000, with inventory higher than many markets on the list. Demand continues to absorb that supply, keeping prices steady. Growth has paused and that pause is what’s preserving value.
Sun Lakes: Stability by Design
(Top 10 YoY growth: 3.6% | ZIP 85248)
Like Green Valley, Sun Lakes operates on predictability rather than pace. As an age-restricted community with low turnover, modest appreciation reflects demographic insulation rather than market pressure. Homes change hands slowly. Owners stay longer. Volatility is limited by design. Here, stability isn’t a phase. It’s the point.
Casas Adobes: Two ZIP Codes, One Misleading Number
(Top 10 YoY growth: 2.3% | ZIPs 85704 & 85705)
Casas Adobes blends two distinct housing environments.Higher-end 85704 retains pricing power, while more affordable 85705 supports turnover through accessibility. In both, prices have flattened and price reductions are common.
Year-over-year growth reflects earlier appreciation not current momentum.
What Arizona’s Market Is Really Saying
Arizona is no longer behaving like a single housing market and Top 10 rankings flatten that reality. What Arizona Ascent sees heading into 2026 isn’t decline, and it isn’t another surge. It’s differentiation. Lifestyle markets are pausing.
Metro markets are steady. Affordable markets are holding. Demographic markets are stable. A few outliers continue to move. That isn’t a warning sign. It’s what happens when a market grows up.
Reading the Moment Correctly
Zillow and Redfin are effective at showing where prices were. Local data shows how people are behaving now. For homeowners, buyers, and communities across Arizona, that distinction matters more than a ranking ever could.